.png?width=287&height=287&name=social%20post%204%20(5).png)

.png?width=287&height=287&name=social%20post%201%20(1).png)
Why Morgan Sindall Construction uses Sablono:
“We needed a solution that would help us improve confidence with business stakeholders by ensuring all relevant details were fully documented. We needed the ability to derive KPIs and real-time site data so that we could actively drive operational efficiency and on-site productivity.”
David Williams
Morgan Sindall Construction

INSIGHTS
Get real-time, accurate insights
Stay on top of your project with real-time data direct from the site. Automatically visualise the current status of your work areas and easily filter by deliverable, team, and area. Then, use these accurate insights to update your look-ahead plan for the upcoming days, weeks, and months.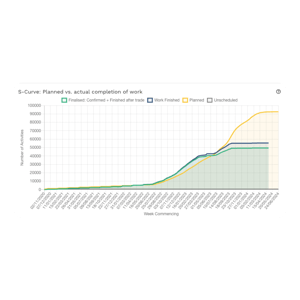
DASHBOARDS
Understand what’s really happening on your project
Make use of intuitive dashboards and automated KPIs to detect what's falling behind and understand the real implications of delays. Sablono helps you identify patterns and uncover the root cause of problems in your processes. Instantly detect performance gaps and take action before it's too late.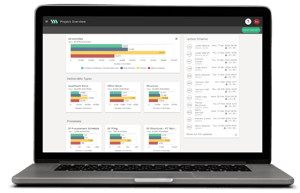
REPORTS
Generate and share accurate reports in moments
Say goodbye to manual report creation. Create custom reports and save up to 60% of the time spent on documentation and upstream business reporting. Automatically generate reports and share them with your stakeholders in moments for hassle-free reporting.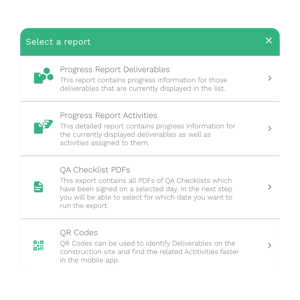
Key features
 Look-Ahead Planning
Update your look-ahead plan for the upcoming days, weeks and months based on reliable and highly granular progress data.
Read More
Look-Ahead Planning
Update your look-ahead plan for the upcoming days, weeks and months based on reliable and highly granular progress data.
Read More
 Planned vs Actual Dashboards
Understand how you’re progressing against your plan and adapt accordingly.
Read More
Planned vs Actual Dashboards
Understand how you’re progressing against your plan and adapt accordingly.
Read More
 Commercial Dashboard
Link costs directly to your site activities to see what the status of your project means for your finances.
Read More
Commercial Dashboard
Link costs directly to your site activities to see what the status of your project means for your finances.
Read More
 Deliverable List & Reports
See all of your deliverables and export reports to share progress in moments.
Read More
Deliverable List & Reports
See all of your deliverables and export reports to share progress in moments.
Read More
 Commercial Planned Works Valuation
Valuate actual achieved planned works at the push of a button and pay your subcontractors accordingly.
Read More
Commercial Planned Works Valuation
Valuate actual achieved planned works at the push of a button and pay your subcontractors accordingly.
Read More
 Commercial Look-Ahead
Unlock forecasted upcoming costs for your project based on your programme.
Read More
Commercial Look-Ahead
Unlock forecasted upcoming costs for your project based on your programme.
Read More
 Issue List & Reports
See all issues raised and export PDF reports to streamline their resolution or as evidence of quality and compliance standards being met.
Issue List & Reports
See all issues raised and export PDF reports to streamline their resolution or as evidence of quality and compliance standards being met.
 Activity Sign-off
Management is automatically notified when activities are marked as complete so all work can be reviewed before sign-off.
Activity Sign-off
Management is automatically notified when activities are marked as complete so all work can be reviewed before sign-off.
 Issue Sign-off
Management receives automatic notifications as soon as issues are flagged and has final sign-off before the issue is marked as resolved.
Issue Sign-off
Management receives automatic notifications as soon as issues are flagged and has final sign-off before the issue is marked as resolved.
 Issue Templates
Create reusable templates for issues which help you to standardise documented issues to streamline their resolution and ensure work always meets quality and compliance standards.
Issue Templates
Create reusable templates for issues which help you to standardise documented issues to streamline their resolution and ensure work always meets quality and compliance standards.
 Automated Handover Notifications
Automated handover notifications are sent to trades mobile devices to let them know that work is ready to start.
Read More
Automated Handover Notifications
Automated handover notifications are sent to trades mobile devices to let them know that work is ready to start.
Read More
 Workflow Templates
Capture processes in reusable templates and plan your workflows down to the most granular detail. Define activities, responsibilities and sign-offs. Add hold points, QA checklists and more.
Workflow Templates
Capture processes in reusable templates and plan your workflows down to the most granular detail. Define activities, responsibilities and sign-offs. Add hold points, QA checklists and more.
 Progress Audit Trail
Digital records of everything that happens on your project are automatically saved in the progress audit trail.
Read More
Progress Audit Trail
Digital records of everything that happens on your project are automatically saved in the progress audit trail.
Read More
 Quality Audit Trail
Create a fully accountable, connected digital audit trail of all quality-related data.
Quality Audit Trail
Create a fully accountable, connected digital audit trail of all quality-related data.
 Photo Documentation
Attach geo-tagged photos as evidence of quality and compliance standards being met.
Read More
Photo Documentation
Attach geo-tagged photos as evidence of quality and compliance standards being met.
Read More