

.png?width=287&height=287&name=social%20post%204%20(5).png)

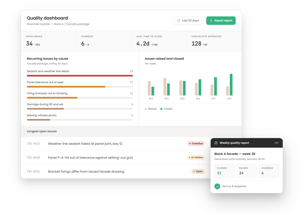
See where quality problems are coming from
Compare Issues across work packages, trades and project areas to identify where quality performance needs attention. Filter the dashboard to move from a project-wide view to the teams and packages driving the numbers.
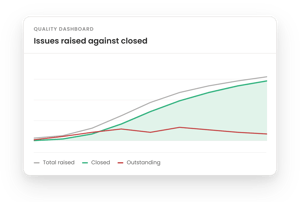
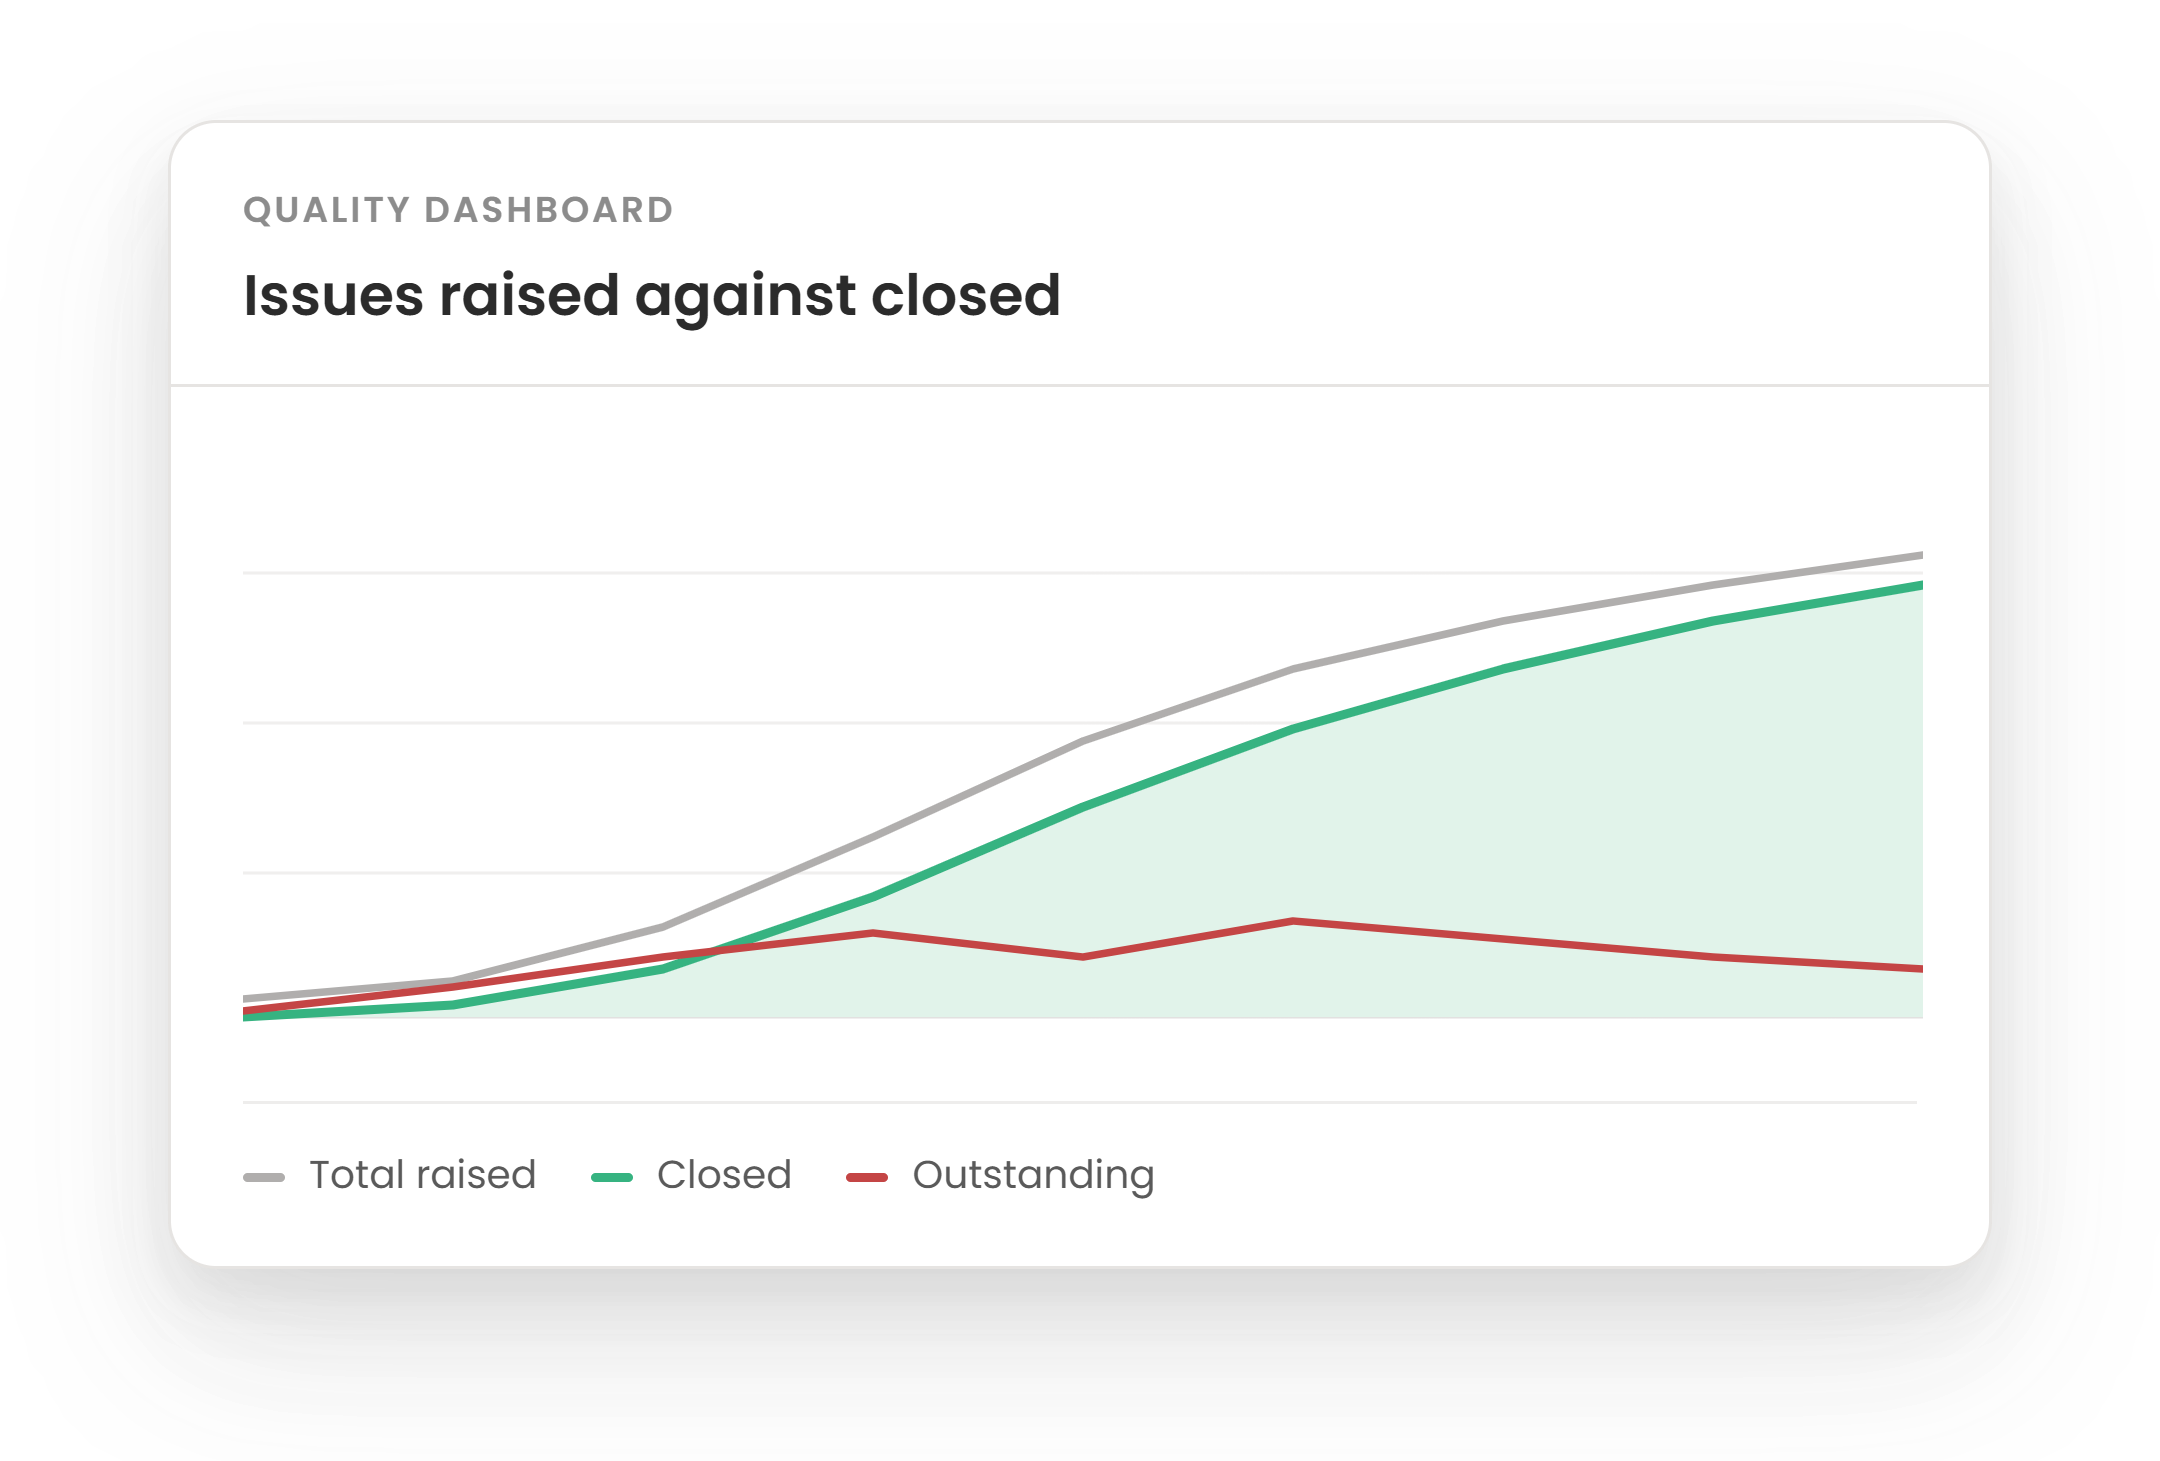
Track quality performance over time
See how Issues develop over time instead of relying on a single snapshot. Identify recurring patterns, understand whether corrective actions are working and use consistent quality KPIs to support continuous improvement.
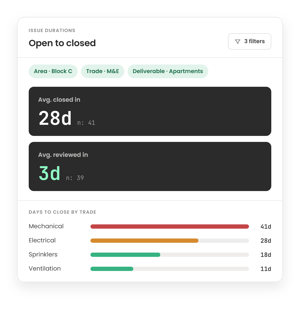
Find where Issues are taking too long to close
Track issue duration and resolution performance to uncover bottlenecks. Filter by area, trade, package or other project dimensions to focus follow-up where delays are accumulating and quality risks remain open.
Why use the Quality Dashboard?
.svg)
Without a live quality view
Quality data is spread across reports and listsRecurring problems are hard to spot
Follow-up is driven by anecdotes instead of trends

With Sablono
Live quality KPIs in one placeTrends visible across trades and packages
Targeted action based on project data
Quality Dashboard for all use cases
See all use cases






- 01 Quality Dashboard
- 02 Deliverables Dashboard
- 03 Activity Drilldown
- 04 Run Rate and Performance Dashboard
Quality Dashboard
Gain deep insights into your subcontractors’ performance, spot quality trends, and address any recurring issues with data-driven discussions.
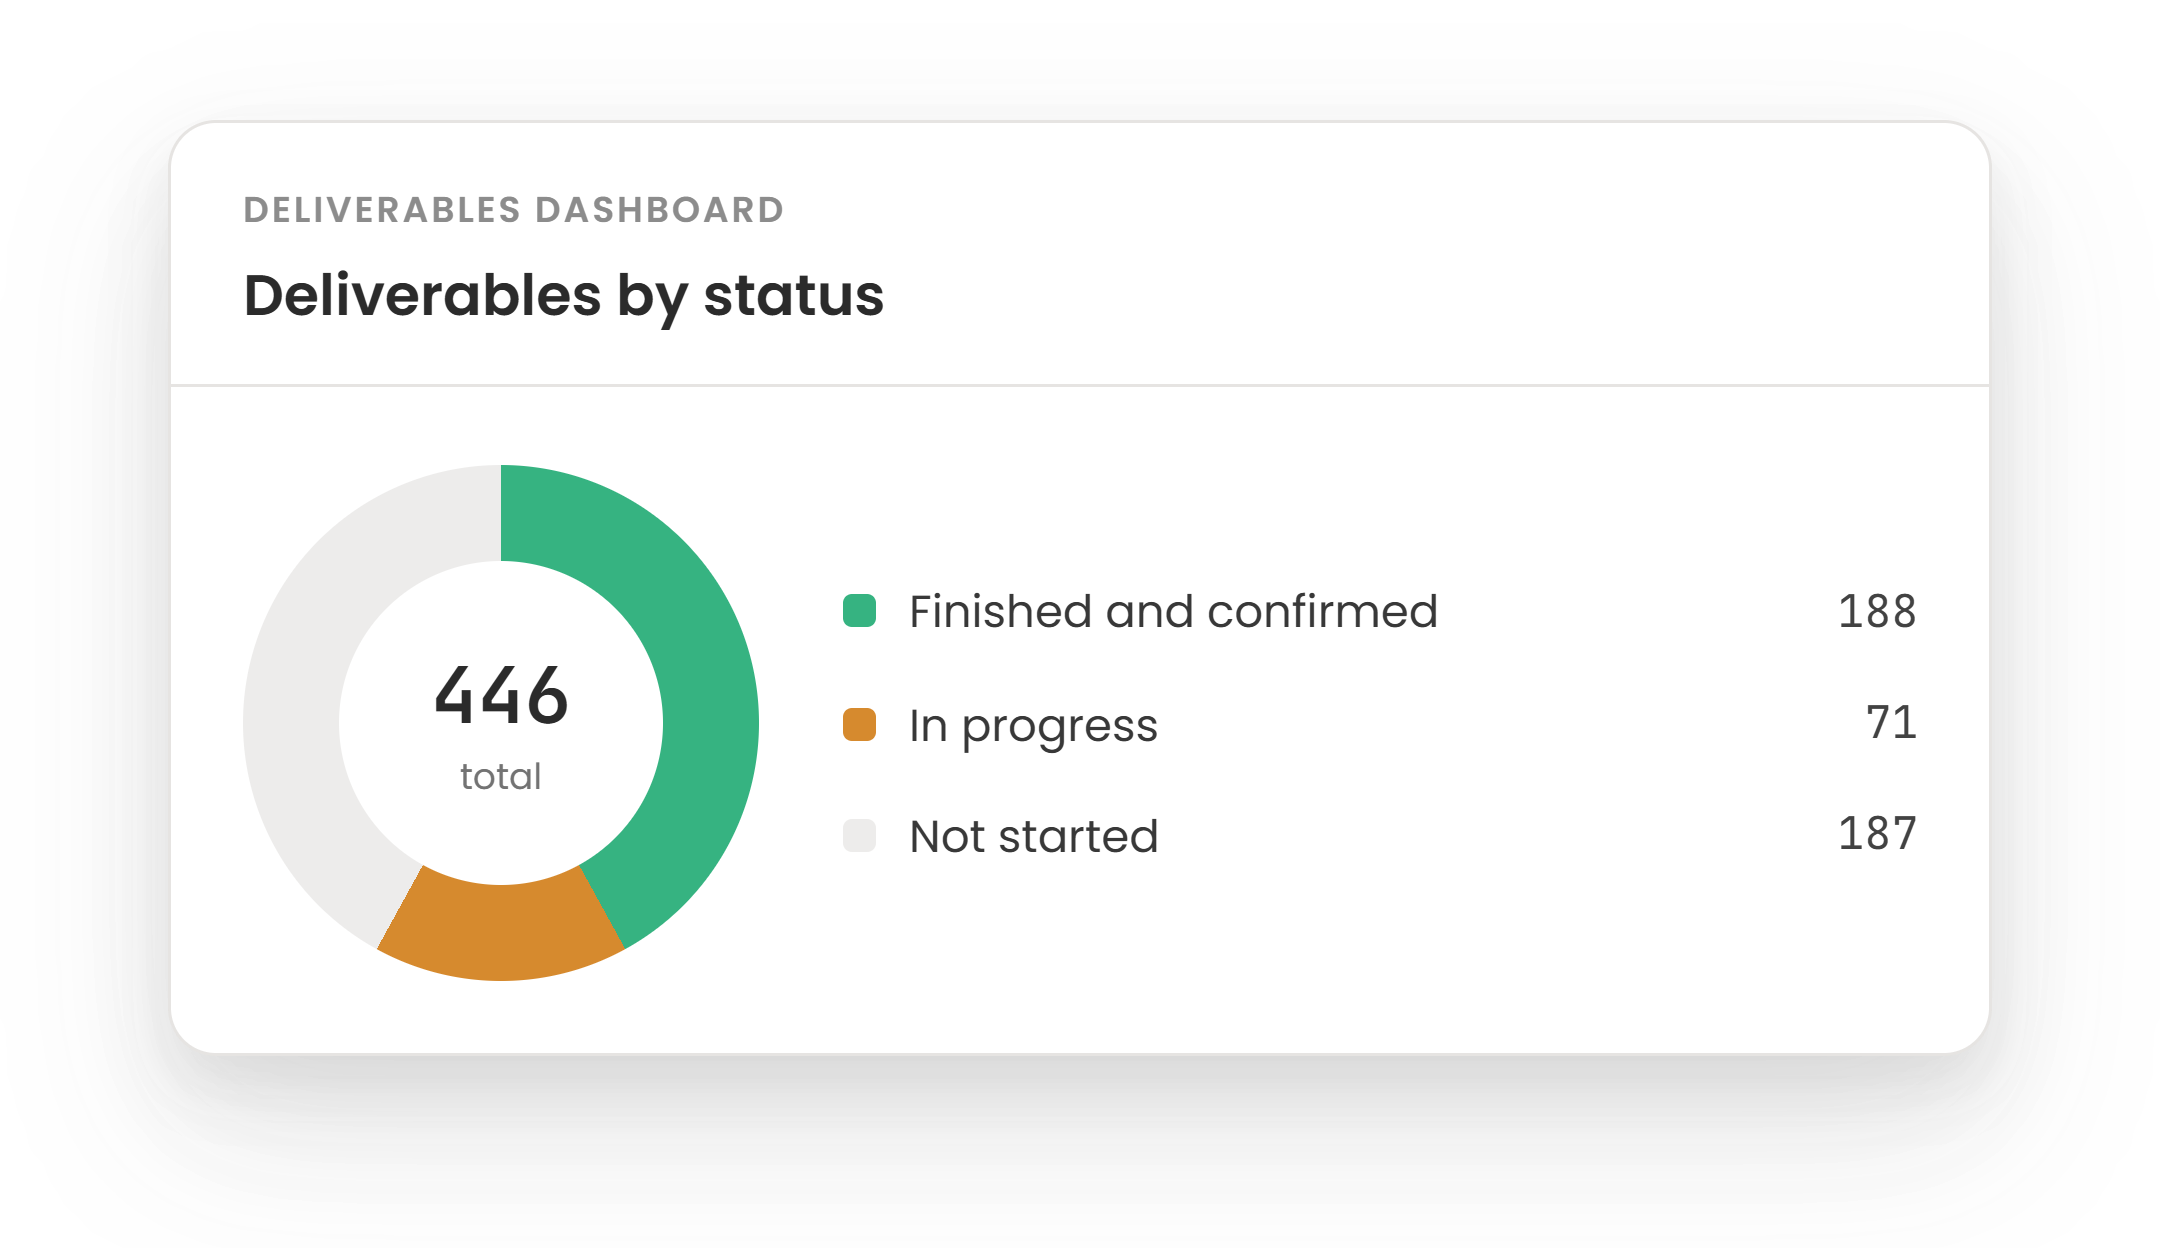
Deliverables Dashboard
Effortlessly communicate progress and expectations with a high-level milestone overview to ensure clarity with your subcontractors.
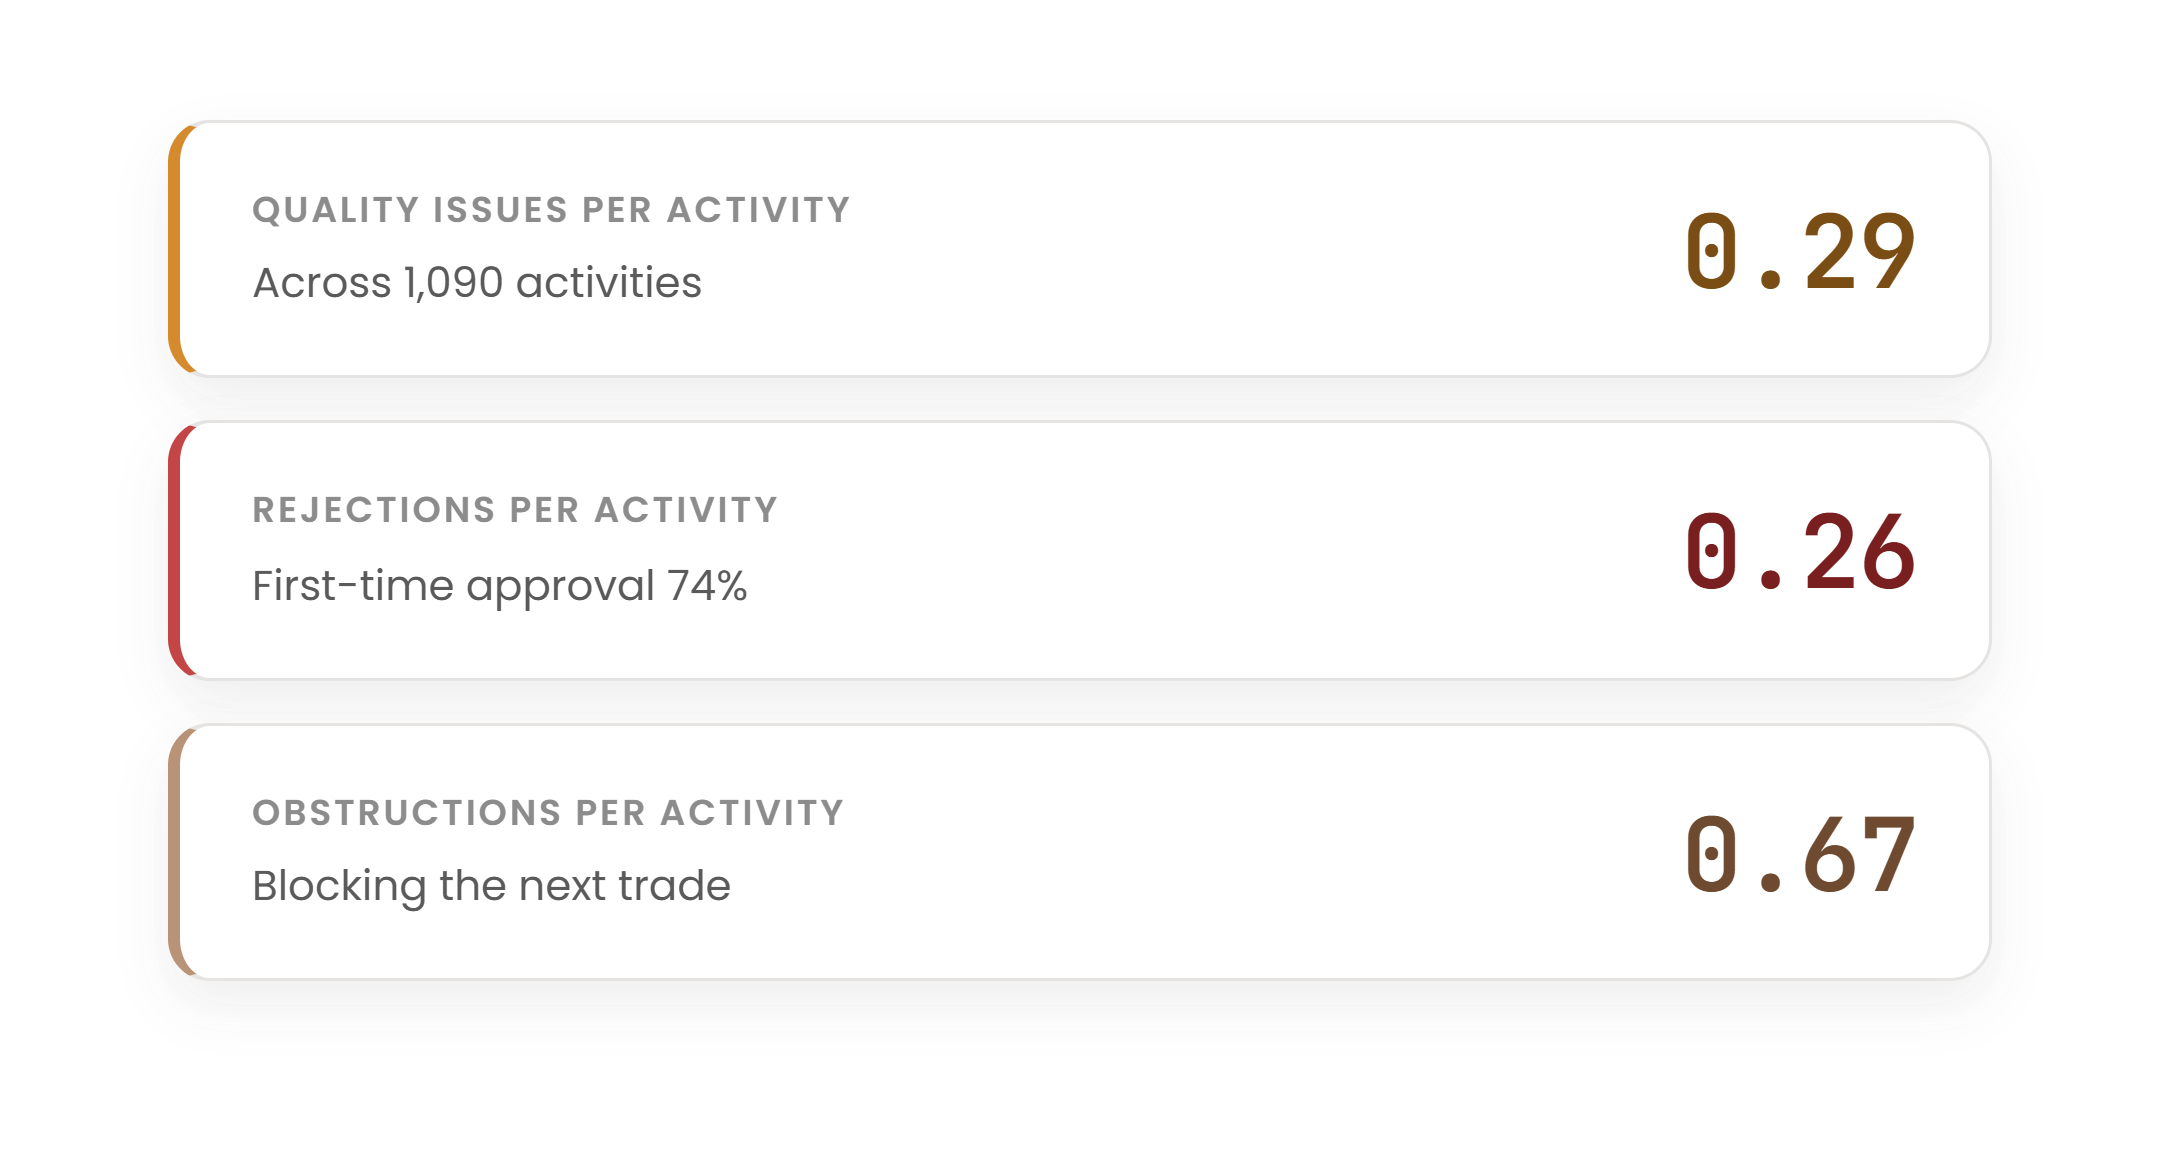
Activity Drilldown
Dive into detailed data to identify specific challenges and tackle root causes before they impact overall project success.
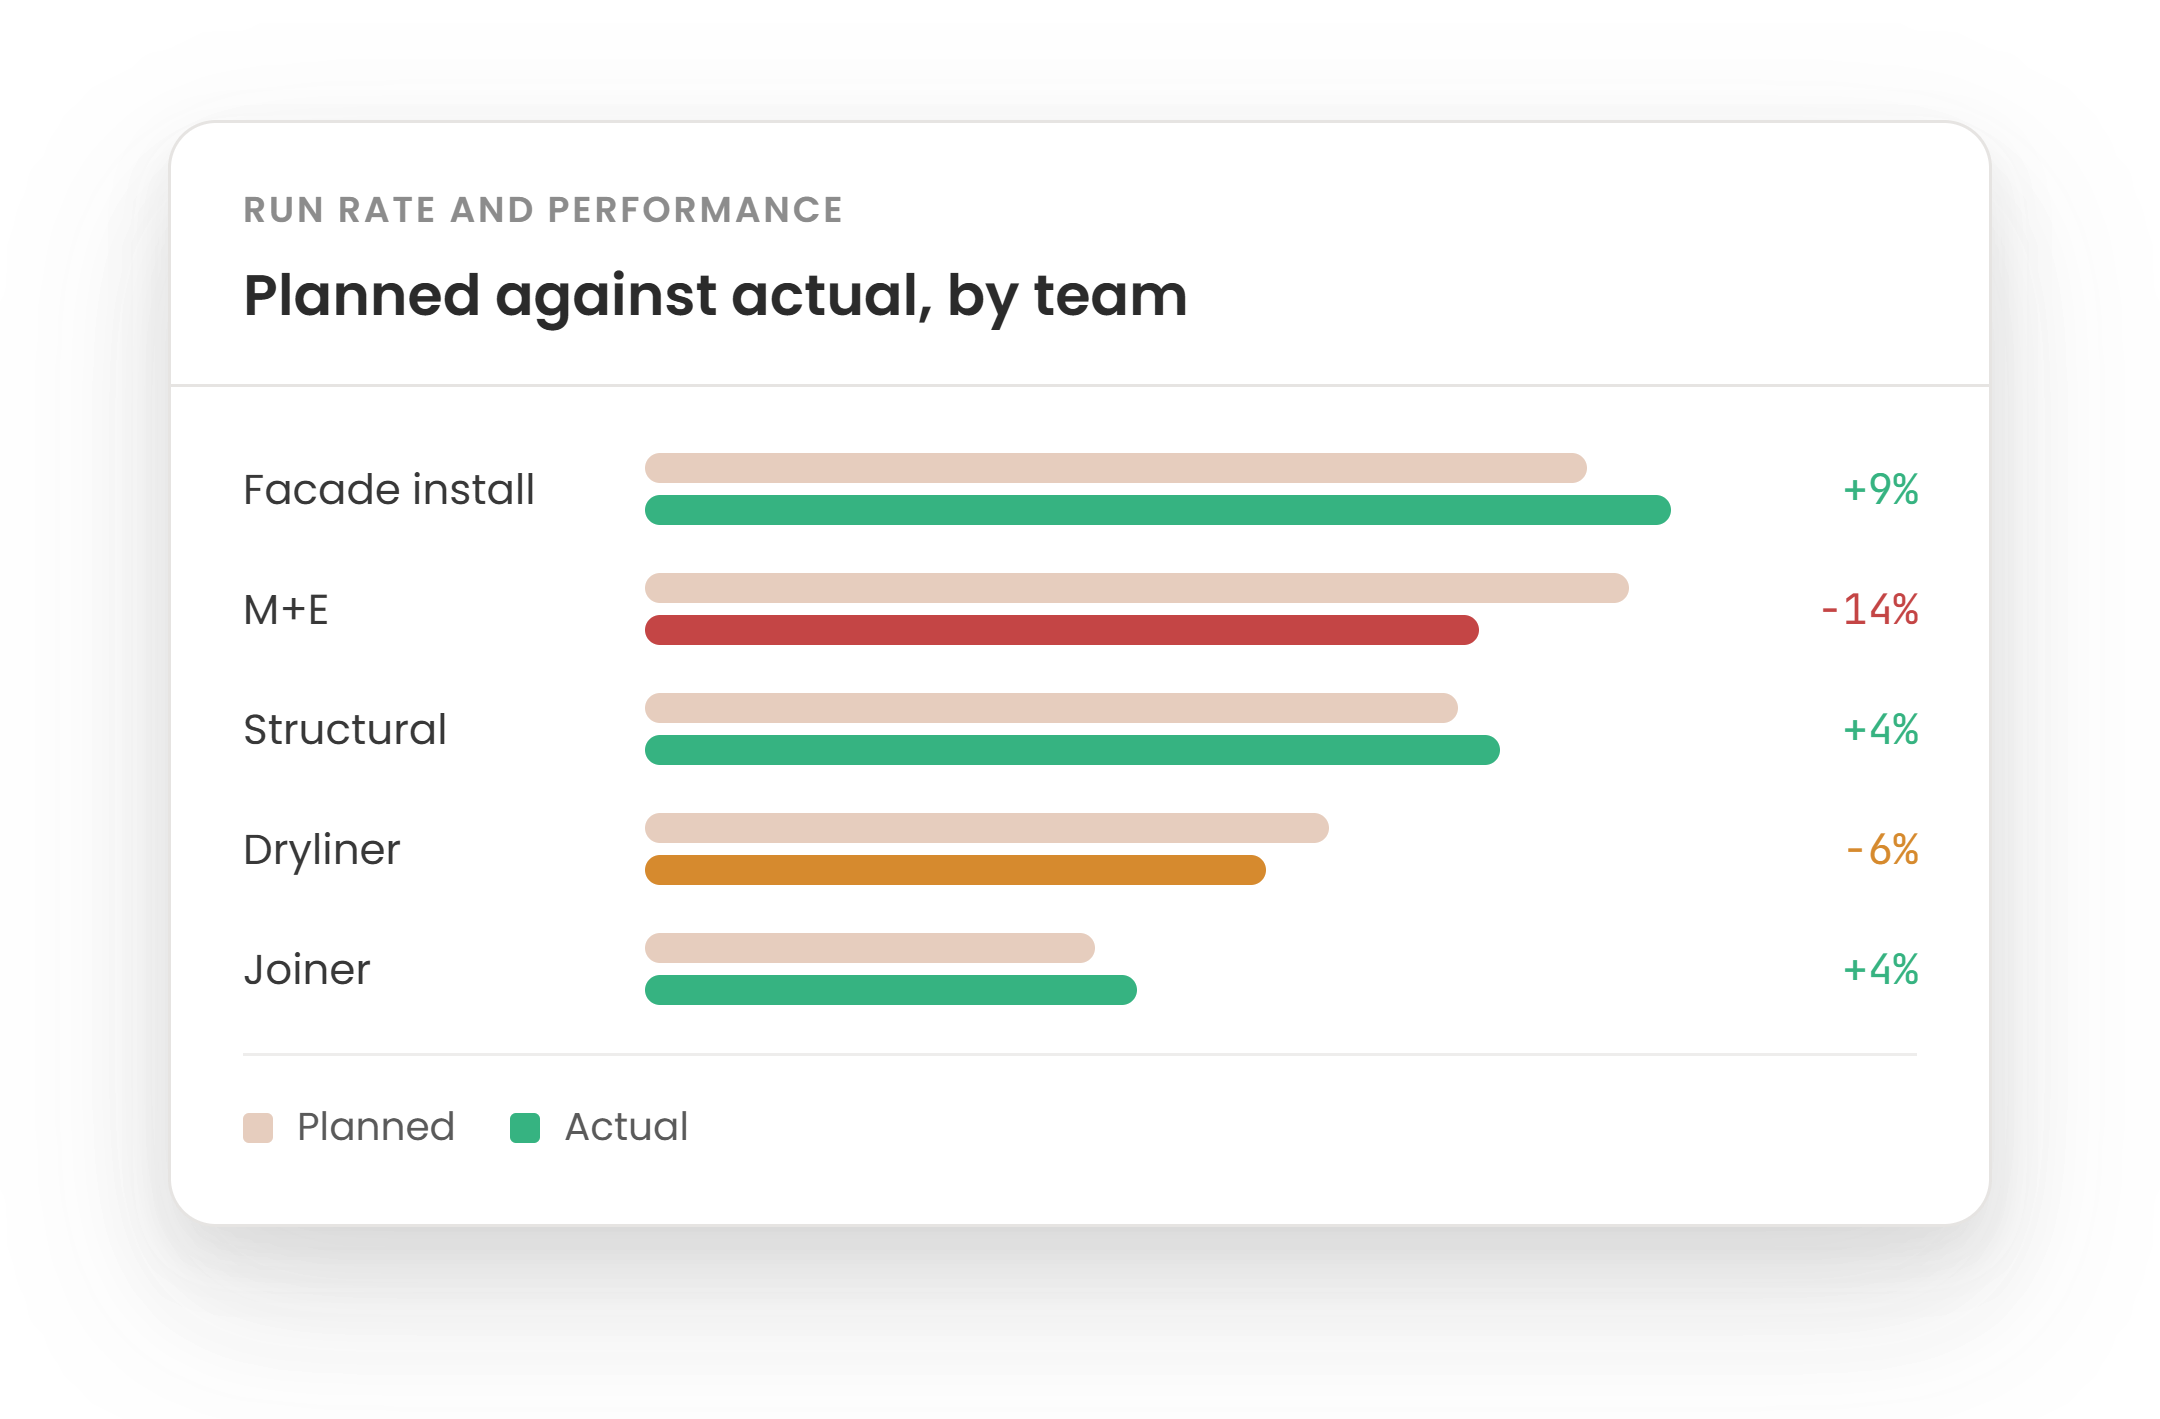
Run Rate and Performance Dashboard
Track each subcontractor’s performance against the project plan, identifying gaps and areas for improvement in real-time.
Bring it all together
Quality Dashboard is just the beginning. Use it with Sablono's other quality and compliance features to get more done with less. QA Checklists
Attach QA checklists to workflow activities to ensure that all required quality data is captured in one go.
Read More
QA Checklists
Attach QA checklists to workflow activities to ensure that all required quality data is captured in one go.
Read More
 Activity Sign-off
Management is automatically notified when activities are marked as complete so all work can be reviewed before sign-off.
Activity Sign-off
Management is automatically notified when activities are marked as complete so all work can be reviewed before sign-off.
 Issue Sign-off
Management receives automatic notifications as soon as issues are flagged and has final sign-off before the issue is marked as resolved.
Issue Sign-off
Management receives automatic notifications as soon as issues are flagged and has final sign-off before the issue is marked as resolved.
 Issue List & Reports
See all issues raised and export PDF reports to streamline their resolution or as evidence of quality and compliance standards being met.
Issue List & Reports
See all issues raised and export PDF reports to streamline their resolution or as evidence of quality and compliance standards being met.
 Issue Templates
Create reusable templates for issues which help you to standardise documented issues to streamline their resolution and ensure work always meets quality and compliance standards.
Issue Templates
Create reusable templates for issues which help you to standardise documented issues to streamline their resolution and ensure work always meets quality and compliance standards.
 Photo Documentation
Attach geo-tagged photos as evidence of quality and compliance standards being met.
Read More
Photo Documentation
Attach geo-tagged photos as evidence of quality and compliance standards being met.
Read More
 Quality Audit Trail
Create a fully accountable, connected digital audit trail of all quality-related data.
Quality Audit Trail
Create a fully accountable, connected digital audit trail of all quality-related data.