.png?width=287&height=287&name=social%20post%204%20(5).png)

.png?width=287&height=287&name=social%20post%201%20(1).png)

DETAILED KPIS
Get clear KPIs for critical activity status
Quickly assess your project status with clear KPIs and an intuitive chart for at-glance insights. Instantly see the number of activities behind schedule, the number of activities waiting for confirmation and more. These KPIs are linked to Sablono's Activity Tracker allowing you to monitor activities based on their current status..png?width=300&name=Run%20rate%20-%20KPIs%20(1).png)
PRODUCTIVITY
Understand productivity, run rate and trends
Track your run rate against the plan based on accurate progress data and use these insights to optimise your performance. Quickly detect who's falling behind so you can take action to fix it..png?width=300&name=Run%20rate%20-%20productivity%20(2).png)
PERFORMANCE
Spot progress problematic packages and trades
Pinpoint trades and work packages that may be causing delays. Filter by specific work package or trade to dive deep and understand trends. Access detailed KPIs to track the performance of trades and packages - from planned vs actual durations, available until started gap, confirmation gap and more.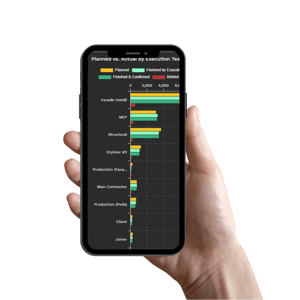
THE RESULTS ARE CLEAR
Why use Run Rate and Performance Dashboard
Without Sablono
Limited performance visibilityLack of immediate insights
Struggle to stay on track
With Sablono
Real-time performance trackingClear insights at a glance
Planned vs Actual metrics
Run Rate and Performance Dashboards for all use cases
See all use cases
Façade package
Accurately track façade panels, manage and store quality data for each panel in one place and finish in record time.

Fit-out package
Simplify handovers during fit-out, understand how your package is progressing in real-time and keep all your trades on the same page.

Remediation works
Easily coordinate all remedial work in one place, plan your workflows down to the smallest detail, and keep a digital record of the entire remediation process.

Piling package
Plan your piling package down to the smallest detail, adapt to unforeseen ground conditions quickly and work faster.

Firestopping
Streamline your firestopping workflows, store all your documentation in one place and access this at any time as evidence of compliance.

Structural package
Manage and coordinate all aspects of your structural package. Plan your workflows down to the smallest detail and keep a clear record of compliance.

Facade and Balcony production
Efficiently produce and manage façades and balconies with streamlined processes and meticulous quality control using our innovative production tracking system.

Bathroom production
Optimize your bathroom production process with precise tracking, comprehensive quality management, and accelerated project completion using our specialized system.

Kitchen production
Utilize our advanced system to efficiently track kitchen components, streamline quality management, and expedite project completion for unparalleled results.

POD installation
Enhance your prefabricated pod installation process with precise tracking, centralized quality management, and accelerated project timelines using our innovative solution.

Solar installation
Maximize efficiency and quality assurance in solar panel installations by utilizing our comprehensive tracking system to manage and store critical data, ensuring timely completion with optimal results.
- 01 Quality Dashboard
- 02 Deliverables Dashboard
- 03 Activity Drilldown
- 04 Run Rate and Performance Dashboard
Quality Dashboard
Gain deep insights into your subcontractors’ performance, spot quality trends, and address any recurring issues with data-driven discussions.
Deliverables Dashboard
Effortlessly communicate progress and expectations with a high-level milestone overview to ensure clarity with your subcontractors.

Activity Drilldown
Dive into detailed data to identify specific challenges and tackle root causes before they impact overall project success.

Run Rate and Performance Dashboard
Track each subcontractor’s performance against the project plan, identifying gaps and areas for improvement in real-time.

Bring it all together
Sablono's Run Rate and Performance Dashboard is just the beginning. Use it with Sablono's other payment valuation and intelligence features to get more done with less. Commercial Dashboard
Link costs directly to your site activities to see what the status of your project means for your finances.
Read More
Commercial Dashboard
Link costs directly to your site activities to see what the status of your project means for your finances.
Read More
 Commercial Look-Ahead
Unlock forecasted upcoming costs for your project based on your programme.
Read More
Commercial Look-Ahead
Unlock forecasted upcoming costs for your project based on your programme.
Read More
 Commercial Planned Works Valuation
Valuate actual achieved planned works at the push of a button and pay your subcontractors accordingly.
Read More
Commercial Planned Works Valuation
Valuate actual achieved planned works at the push of a button and pay your subcontractors accordingly.
Read More
 Baseline Scheduling
Transform your baseline into a detailed production plan and streamline the scheduling of more than 100,000 activities per project.
Read More
Baseline Scheduling
Transform your baseline into a detailed production plan and streamline the scheduling of more than 100,000 activities per project.
Read More
 Look-Ahead Planning
Update your look-ahead plan for the upcoming days, weeks and months based on reliable and highly granular progress data.
Read More
Look-Ahead Planning
Update your look-ahead plan for the upcoming days, weeks and months based on reliable and highly granular progress data.
Read More
 Planned vs Actual Dashboards
Understand how you’re progressing against your plan and adapt accordingly.
Read More
Planned vs Actual Dashboards
Understand how you’re progressing against your plan and adapt accordingly.
Read More