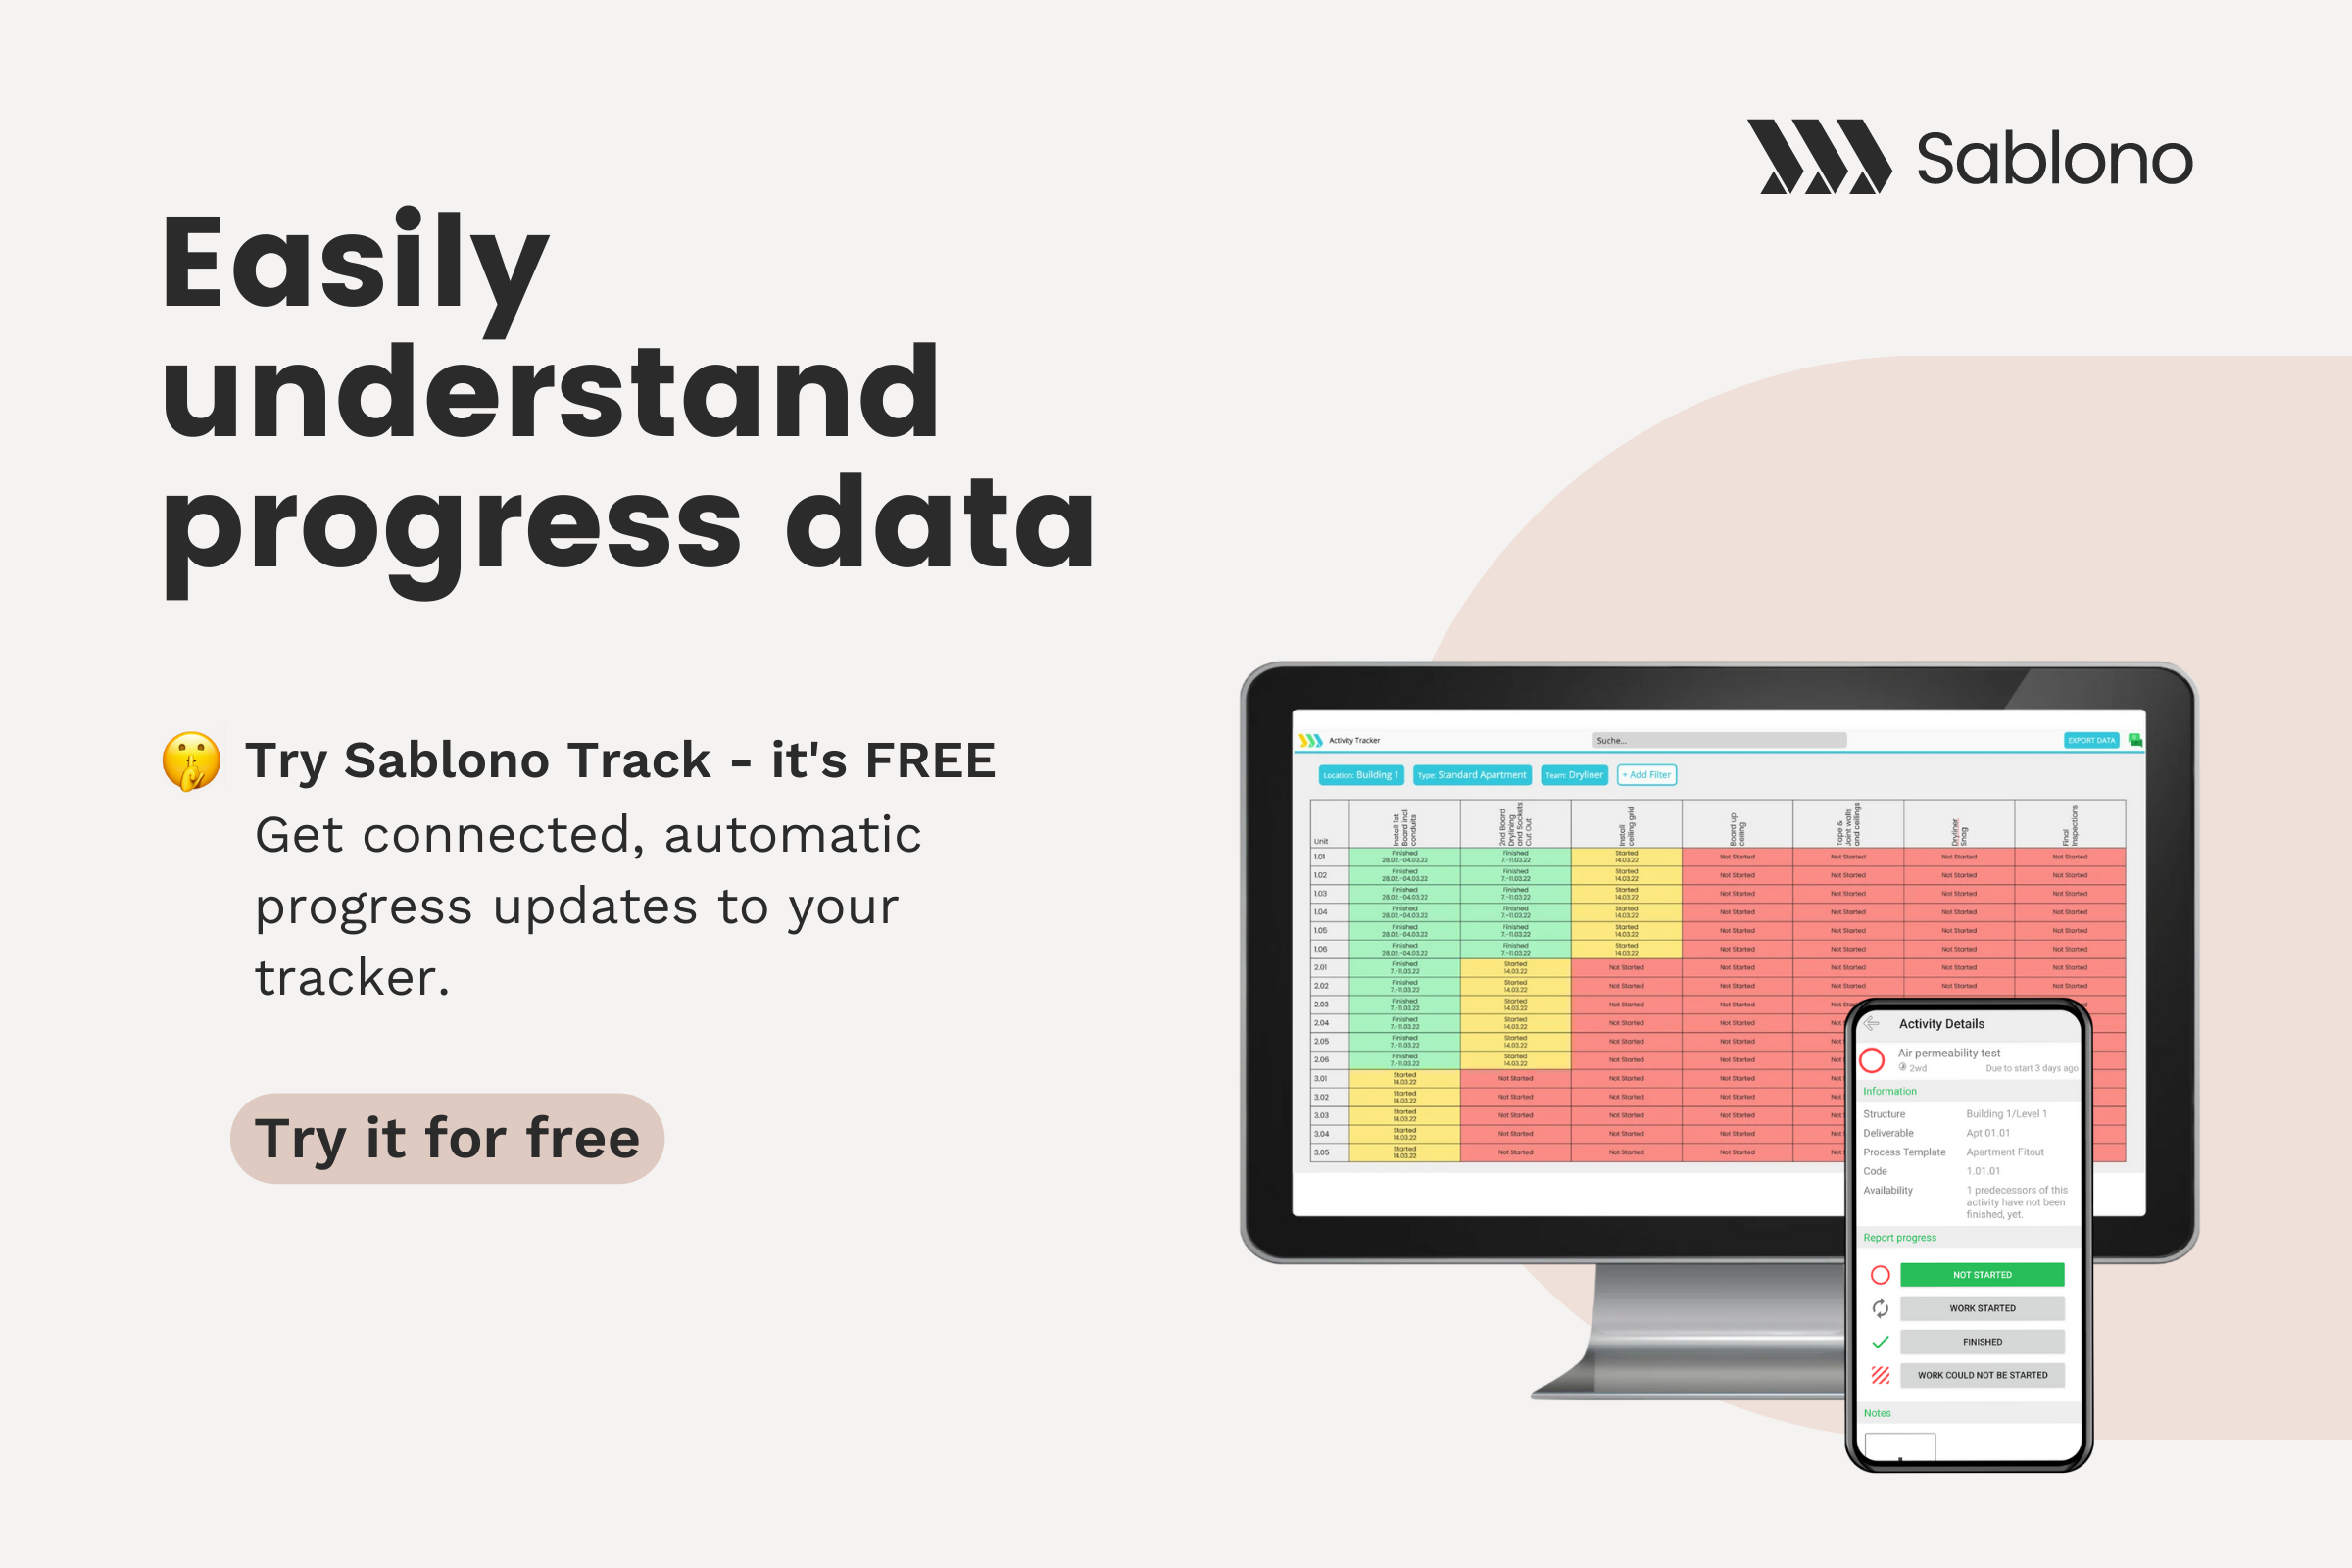
One of the most vital pieces of information helping project managers in various industries to steer their projects in the “right” direction is the comparison of “what should have been done” vs. “what has actually been done”.
While one might assume that “the planned” information should be easily gathered from the initial project programme – in reality and especially in the AEC industry – project managers struggle to keep their project schedules up-to-date.
Oftentimes, schedules are abandoned during the project’s execution phase due to the massive amount of changes in their timelines. These changes lead to an enormous overhead and additional effort to update the programme, especially if this needs to be done with tools such as MS Project, Excel or Asta Powerproject.
Which brings us to the second piece of information required – “the actual”. While “the planned” at least is achievable if you and your team choose to invest valuable time into the matter, there is no tool out there which will deliver “what has actually been done” in the required quality.
This absence of tools leads to the situation you encounter in nearly every construction project executed today: Project managers investing most of their day manually collecting the most vital information while being unable to execute their actual duty – steering the project.
We believe, it’s about time to fix this. Our web-based construction management platform Sablono not only helps you to keep your programme up-to-date by using process templates to define and monitor up to a million activities per project.
It also offers an easy-to-use and collaborative way of collecting the “actual” data. It doesn’t matter whether you and your partners are using the mobile app Inspect, the modern web interface or even good-old emails to update the platform: The progress of your project will be collected and kept in one central database.
Stop collecting data and let your data work for you instead. Sablono offers multiple ways of visualizing the “planned vs. actual”:
“Planned vs. actual”-chart: Use this chart on Sablono’s Dashboard to understand in detail “how many deliverables should have reached a certain state of their process” and “how many actually reached that state” as of now.
A click on one of the presented bars will forward you to a filtered list showing exactly those deliverables you are most interested in. Form here you can dive into more detail to quickly understand what happened.
2D Visualization: Sablono is not only able to automatically visualize the current state of each deliverable in 2D drawings uploaded to the system, but can also show which deliverable is running behind schedule.
If the reported “actual” differs from “planned” progress, deliverables are coloured red. Even quality issues or obstructions are included here.
Smart Deliverables list: Use this list to filter the deliverables of your project. Are you interested in all tasks “which are running behind schedule and were planned for the current week” or “which activities were planned for the upcoming week that already carry obstructions or issues”? You’ll have no problem finding that kind of information using Sablono.
Bar chart: Even the traditional bar chart is directly connected to Sablono’s extensive data. Tasks running behind schedule will be shown in red while those running on time will be green. Once quality issues and obstructions arise they will also be included directly in the bar chart.
Lean Board: The latest addition to the platform will help you keep your weekly work plan up-to-date. Of course, also here Sablono will highlight activities running behind schedule.
The Lean Board not only enables you to create digital work plans on a weekly basis but also makes the most out of the collected “actual” data by helping you to reschedule activities based on the real-time progress of your site so you can stay on track with your projected plan.
We at Sablono strongly believe in a better, leaner and more productive future.

David Jung, Head of Product at Sablono
.png?width=287&height=287&name=social%20post%204%20(5).png)
.png?width=287&height=287&name=social%20post%201%20(1).png)

.png?width=302&height=302&name=social%20post%204%20(6).png)

